Kohinoor Power Co. Ltd: A MBA Report
Kohinoor Power Co. Ltd. : MBA Report
Kohinoor Power has only one customer, Kohinoor Industries. This is a group company and it is being supplied power on credit for the past 16 months. The management is supplying power at a generous discount of 15% as compared to WAPDA tariff rates. This is a case of pure partisanship, as in the abscence of taxes on the captive power industry the objective should have been to maximie profits. The company is facing a collection crises. Trade debts for FY96 reflect 100% credit sales with 18% carried over from FY95. The company started production in 1992 and is eligible for a tax holiday. The company’s EPS shows an increase from 4.8 to an estimated 5.15 for the FY96.The biggest weakness of the company is its dependence on a sole customer, Kohinoor Industries. Plans for providing power to Azam Textile Mills and Saritow Textile Spinning (belonging to the same group), have been shelved due to the prolonged recession in the textile sector. The sole customer is facing an acute crises and possible reduction in its capacity ( around 10,000 spindles). Kohinoor Power is operating at 80% capacity, which is around the maximum possible in this environment. The company has not paid any iviens since its inception an in lieu of its current cash flow problems and the recession in the textile sector, it is not likely to do so in the future. Kohinoor’s cost per MW is only Rs 17mn (sector average Rs 23mn). However it has a large amount of short term debt, which accounts for 32% of financial and other charges (sector average is 5%). All these factors make the low Pes irrelavent.
Company Analysis
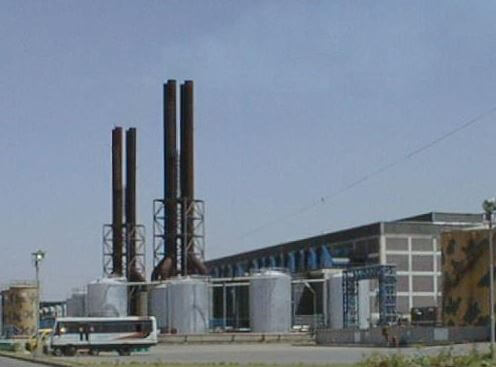
Kohinoor Power Limited (KPL), located at Faisalabad, was established in 1991 and started commercial production in January ,1992 with a total generating capacity of 10.2 MW. With the installation of another set of 5.1MW in April 1994, the production capacity was enhanced to 15.3MW. KPL was amongst the earliest captive power plants set-up in the private sector. The company was launched with the initial cost of Rs. 176 mn by the reputable Saigols group, which are currently involved in a host of diverse business activities in Pakistan. The group has been one of Pakistan’s pioneering business families and enjoys a sound reputation.
Sponsor’s Background
KPL supplies all its electricity to Kohinoor Industries Lts (KIL) – the group’s main concern. KIL was established more than 40 years ago and is one of the largest textile composite units iin Pakistan. It produces cotton and blended yarn. With an installed capacity of 147,000 spindles it was considered a very solid company until the textile crises struck. Adverse conditions forced KIL to close their weaving unit in 1994. Thus only the spinning unit was left intact. Keeping in view the current situation the productivity of KIL is bound to take only one direction – downwards. This will have a direct impact on the revenues of KPL as it is totally dependent on its sole customer.
Investment Highlights
Discounted tariffs: KPL sells power to KIL at a 15% discount to WAPDA’s rates. WAPDA tariff on average increases at 15% per annum. Thus the costs will increase @ 16% for FY96 and 15% FY97. The investors in KPL are losing money because of this forced discount. This translates into lower profits for the already ailing KPL.
Reduction in Sales volume: Due to the decreasing productivity and planned divesture of KIL’s spindles, Kpl’s sales are not expected to increase in the forseeable future. The increases in earnings in FY97 are supposedly from increases in tariff rates and a constant decrease in financial charges on long erm loans.
Capacity utiliation: Currently the plant is operating at a capacity of 80%, which is at par with the industry average. Due to the current situaion of KIL there seems to be no increase in capacity utiliation in the coming years.The only possibilty is that the company diversifies its customer base, however this is extremely unlikely.
Customers: The company’s sole customer is KIL. KIL is still recovering from the recession in the textile sector. KIL suffered a loss of Rs 206mn for FY95, this translates to Rs 8.2 per share. The gross margins took a plunge from 17.5% in FY94 to just over 4% in FY95. KPL has a very loose credit policy with KIL resulting in 100% of sales being made on credit in FY96. This has forced KPL into a very poor cash flow situation, resulting in excessive short term borrowings at high interest rates.
Generation Costs: Average cost per MW is only 17mn as compared to 23mn for the sector. Ideally this is an advantage in terms of lower financial charges. However this is being off set by excessive short term borrowings at high interest rates.
Dividends: The company has not announced any dividends and keeping the current situation in view no dividends are likely in the future as well. The company announced a bonus issue in the ratio of 1:5 in Dec 1995.
Conclusion: severe liquidity crises of the customer, no chances of diversification, the prevailing textile situation point towards getting rid of the scrip. Add to this the current devaluation and the political uncertainity plaguing the country, then their is only one option for the investors – SELL!
INDUSTRY OUTLOOK & PRICING STRATEGIES
At present, 11 captive power companies are listed on the Karachi Stock Exchange and around 10 more are expected to be listed within a span of one year, The captive power units have comparatively low business risk because of their guaranteed sales. They can sell electricity to their consumers at any rate less or equivalent to WAPDA tariff structure. However, following the Industry norms, most companies sell at a discount of 5-10% compared to WAPDA’s current rate of Rs.2.98/KWH applicable to most of the Industries.
All the captive power units are the subsidiaries of large business concerns and supply all their generated electricity to a single customer. Moreover, power companies can achieve capacity utilization up to 85% due to their efficient machinery, minimal lines losses and no power thefts. The captive power units have benefited from the 14.5% average increase in tariff structure announced by WAPDA and KESC after the Federal budget for FY 1995-96. According to the fiscal reforms announced in the budget of 1996-97 electricity prices are bound to go up as fuel prices have increased by 10%. A threat associated with the Captive Power units is related to the textile sector. As many of the power plants supply energy to textile concerns, there is a concern of smooth cash flows given the recent troubles that have afflicted this industry. This will be further highlighted in the problems section of this report.
CAPTIVE POWER: BURNING BRIGHTER
The power demand in Pakistan far exceeds its supply. Goverment sources estimate that in 1993, the gap is of 2000 MW with demand growing @ 12% p.a. The supply is lagging behind with a growth rate of 10% p.a. Despite a number of new power projects planned in the private sector and expansion in the public sector the demand – supply is not expected to disappear in the short to near medium term. To bridge this gap through an active participation of the private sector, the present government came up with an attractive incentive package for local as well as foreign investors. The salient features of this incentive package and other advantages offered to Captive Power generators are:
- All the companies are exempted from the corporate income tax.
- Import of plant and equipment without the payment of custom duties, sales tax, iqra, flood relief and other surcharges as well as import license fee.
- Unrestricted repatriation of dividends and equity.
- Exemption of income tax to foreigners who lend to such companies.
- Foreigners are also allowed to setup projects with/without local partners.
- Eligibility for all concessions available to industrial projects.
- Approval of a 80:20 debt to equity ratio as opposed to maximum of 60:40 for all other industrial projects.
- Establishment of private sector energy development fund, which may provide up to 40% of the capital costs of the capital costs of the projects as debt on easy terms such as interest rates of 14% p.a. with a maturity period of upto 23 years including a grace period of 8 years.
- Long term power purchase agreement with WAPDA / KESC for all surplus power guaranteed by the GOP.
- Virtually non-existent distribution and transmission losses.
- Guaranteed customers in the form of parent concerns.
- Highly efficient operations (85% capacity utilization).
THE DARKER SIDE OF THE PICTURE
However, despite all these incentives there is always a possibility that the government might withdraw these benefits at a later stage. As the incentives are given under contract such as the Power purchase agreement (PPA), Fuel supply agreement (FSA), etc., it would be easier for the government to withdraw incentives or impose taxes in case of these captive power plants. The imposition or occurrence of any of the following charges or events can reduce the presently very lucrative margins:
- A possible withdrawal of 10% sales tax and 15% customs duty
- Bright chances for revision in 5% regulatory tax
- Expected hike in prices of furnace oil due to continuos devaluation
- Expected hike in electricity prices by upto 15%
- Waiver of Rs. 0.03/unit electricity duty on industries using private power being imposed
Here are some reasons working against the power sector.
Rupee devaluation
Following the recent Rupee devaluation against the US $, the GOP has decided to increase the prices of petroleum products by 10%. This was not received graciously by the Captive Power industry. Since Captive Power plants supply electricity to their group companies, it is difficult to pass on costs to their parent concerns. At this point in time it is difficult to predict which company will pass on the 10% price hike of furnace oil to their respective consumer. However it is estimated that the net margins of each company would be reduced by a minimum of 3-5% if the price hike is not passed on.
Textile sector
The performance of the textile industry is very much dependent on uncontrollable factors such as floods, attack of pests and weather. As shown by the graph the majority of the Captive Power units are dependent on the textile sector. Couple this fact with the recent recession, the below average cotton production in recent years and declining exports. The result is inevitable, a danger of depression in the demand for Captive Power exists which can hamper the long term growth prospects of this sector.
Credit Sales
The captive power industry is facing severe cash flow crises. This is due to the sales on credit to the parent companies. The recent recession in the textile sector has forced the parent concerns to buy electricity on credit. Also, as some analysts argue, captive power units have been set up to entitle the parent companies to free electricity. This has plunged this sector into severe uncertainty.
Management practices
Another critical factor for the industry are the credentials of the management. A conflict of interest can arise while setting up the selling price of the electricity. The management, in order to support the main concern, may deliberately set tariff rates at the lower side. This will adversely affect the captive power unit. Interestingly, it can be in the interest of the group to pass on the increased costs in the form of increased tariffs to the parent companies. There is no corporate tax on the profits on captive power companies. Charging higher tariff rates to the tax paying consumer would reduce pre-tax earnings, and therefore effectively reduce the parent companies tax burden. The benefit of the increased tariff will accrue to the group and the minority share holders, through the tax exempt captive power unit.
| Valuation Statistics | 95 | 96F | 97F |
| PAT Rs. mns | 58 | 62 | 75 |
| EPS (Rs/Share) | 4.8 | 5.15 | 6.21 |
| EPS Growth (%) | – | 6.61 | 20.61 |
| PEx | 1.55 | 1.46 | 1.21 |
| BVS (Rs/share) | 22.08 | 27.22 | 3.43 |
| Group | Saigol |
| Chief executive | M.Naseem Saigol |
| Major shareholders | % |
| Joint stock companies | 48.26 |
| Individuals | 26.09 |
| Foreign companies | 9.77 |
| Year end | June | |
| Shares Outstanding | mns | 12.000 |
| Market Capitalisation | Rs. mns | 90.000 |
| US$ mns | 2.57 | |
| Ave Daily Turnover | Rs. mns | .357 |
| US$ | 11402 | |
| Price Hi-Lo (Rs.) last 12 months | 31.65-7.5 | |
| Ave Price (rs.) last 12 months | 12.29 | |
| Beta | 1.45 |
| Income statement | 95 | 96F | 97F |
| Yr end June 30th
\ Rs. 000’s |
|||
| Sales | 214,832 | 218,797 | 229,737 |
| Cost of sales | 112,608 | 115,533 | 118,179 |
| Gross profit | 102,224 | 103,264 | 111,558 |
| Adm&gen Expenses | 3,199 | 3,678 | 4,320 |
| Operating profit | 99,025 | 99,586 | 107,328 |
| Other charges | 3,065 | 3,065 | 3,065 |
| Other income | 312 | 312 | 312 |
| EBIT | 96,273 | 96,833 | 104,576 |
| Financial Expenses | 38,044 | 35,000 | 30,000 |
| PBT | 58,229 | 61,833 | 74,576 |
| TAX | – | – | – |
| PAT | 58,185 | 61,833 | 74,576 |