Maple Leaf Cement Company: Financial Ratios Analysis

Cement Industry of Pakistan
BACKGROUND OF THE COMPANY
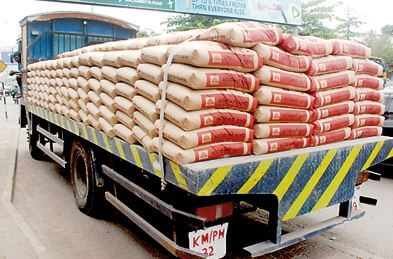
Maple leaf was established in 1950s. Two companies were established in 1960s. During the privatisation of 1991, Kohinoor group of industries bought Maple Leaf. It was incorporated in 1992. Maple leaf cement company produces both white cement and ordinary portland cement.
RATIO ANALYSIS
INTERNAL LIQUIDITY
Current ratio increased significantly in 1995 but again dropped in 1996. It increased in 1995 due to increase in current assets (mainly cash and bank balances along with trade debts). Again current assets declined in 1996. Current assets were 53% of total assets in 1995 and 31% in 1996. Cash holdings increased due to expansion project of Maple Leaf.
Quick ratio went up in 1995 due to increase in trade debts and significant increase in cash and cash equivalents. Again in 1996 it came down because cash decreased and trade debts decreased significantly.
Cash ratio decreased in 1995 and dropped in 1996 mainly due to significant increase in cash and bank balances in 1995. Receivables turnover came down significantly in 1995 because average receivables increase in 1995 and 1996. Average receivables increased because cash sales decreased in 1995 and 1996. Working capital turnover came down in 1995 because current assets increased due to increased cash and bank balances.
Lower turnover ratio in 1995 indicated long life for inventory and slower collection for receivables. This is an indication for cut-back in demand for the firm’s products and sales to customers. Lower working capital turnover might signal potential liquidity problems. Working capital turnover improved in 1996.
OPERATING PERFORMANCE (EFFICIENCY)
Total asset turnover has decreased during the three years. Total assets increased significantly during 1995 and 1996 mainly due to expansion. Asset turnover ratio came down which means that overall investment efficiency has come down and assets are not utilised efficiently as they were utilised before.
Inventory turnover ratio has come down in 1996 which shows that inventory is in shelves more than last year. This is mainly due to reduction in sales in 1996 and increase in cost of goods sold.
Fixed asset turnover has come down significantly in 1995 and 1996 due to expansion project. Fixed asset turnover ratio reflects the level of sales maintained or generated by investments in productive capacities.
Equity turnover ratio has come down in 1995 and 1996. Equity has increased in 1995 mainly due to increase in reserves, increase in issued subscribed and paid-up capital. Equity has increased in 1996 due to increase in authorised capital. EBIT margin has not changed significantly in three years.
OPERTING PERFORMANCE (PROFITABILITY)
Gross profit margin has come down in 1996 mainly due to increase in cost of goods sold and decrease in level of sales. Operating profit has come down year by year due to increase in selling and administrative expenses, increase in cost of goods sold and decrease in sales in 1996. Net profit margin has come down in 1996 due to reduction in sales, reduction in operating profit and increase in COGS. Pretax return on assets decreased because average total assets have increased in 1995 and 1996. Return on equity has come down. Equity has increased during the three years. Shares were issued in 1996 and authorised capital was doubled in 1996.
FINANCIAL RISK
Total debt to equity ratio has come down. Equity has increased over the periods 1995 and 1996 due to increase in reserves, authorised capital and issued subscribed and paid up capital. Long term debt to equity ratio came down in 1995 and then went up in 1996. Long term loans increases significantly in 1996. Debt to total capital declined in 1995 due to increase in capital, came down in 1996. Increase in debt was mainly due to increase in long term loans.
Interest coverage ratio increased in 1995 and slightly came down in 1996. Interest coverage ratio shows the degree of protection available to creditors by measuring the extent to which earnings available for interest cover required interest payments.
OWN VIEW ON COMPANY
Maple Leaf produces cement by wet process. In wet process higher operating costs are incurred, company is located in North Side. There is no chance of dividends. It is very likely that in 1997 loss will be incurred. There are greater financial charges in the coming years. Expansion project is in progress. Gross profit, operating profit and net profit have come down which shows that the company’s profitability is not improving.


